.svg)
.svg)

.svg)
.svg)

Copied to Clipboard

Ready to get Started?

If your actual payroll keeps landing higher than your forecast and you can't quite explain why, you're dealing with a payroll variance problem. The fastest way to fix it: calculate the gap between what you expected to spend and what you actually spent, then break that gap down into its real drivers.
Payroll Variance = Actual Payroll Cost – Expected Payroll Cost
That single formula is the foundation of every variance analysis you'll ever run. The harder work sits around it – setting the right baseline, cleaning your data, and assigning ownership. This guide walks you through all seven steps, with formulas, tables, and examples you can apply to your next pay period.
What Is Payroll Variance?
Payroll variance is the difference between your expected (budgeted or standard) payroll cost for a period and what you actually paid out. It can be favorable (you underspent) or unfavorable (you overspent), and it's measured in both absolute currency terms and as a percentage of the baseline.
A small variance usually reflects normal operational noise like simple rounding, timing of new hires, overtime swings. A persistent or large variance on the other hand, is a signal you need to pay attention to. It might point to forecasting gaps, mis-mapped pay codes, classification errors, or genuine business events you need to investigate.
How Do You Calculate Payroll Variance? Step-by-Step Guide
The core formula for calculating payroll variance is simple:
Payroll Variance = Actual Payroll Cost – Expected Payroll Cost
Let’s look at an example. If your expected payroll for the month was $10,000 and you paid out $11,000, your payroll variance is $1,000 unfavorable, or in other words, 10% over budget.
The formula is the easy part. The seven steps below are what separate a variance number you trust from one that raises more questions than it answers.
Step 1: Define the Baseline and Scope for Payroll Variance
Every reliable payroll variance calculation starts with establishing a consistent baseline. The baseline is the expected or standard payroll cost for a given period. If your baseline shifts significantly between cycles, your variance numbers will also be meaningless because you don’t have a correct set of data to compare it to.
Most organizations pick one of three baseline types:
- Department or Project Payroll Budgets: Best when budget owners are accountable for spend.
- Standard Job Rates or Planned Hours: Useful for operations with defined cost standards (common in government contracts, engineering, or field services).
- Salary Bands Per Role or Region: Works well for global teams where local market rates drive compensation.
Whichever you pick, lock the definitions and timeframes in place. If one cycle compares actuals against budget and the next compares against standard cost, you're measuring two different things and calling them both "variance."
Step 2: Gather and Clean Actual Payroll Data
Variance accuracy rises or falls based on the integrity of your actual payroll data. You need complete extracts of gross pay, overtime, bonuses, employer taxes, and benefits – pulled from your payroll analytics platform or HRIS and reconciled to the general ledger.
The most common reason for inaccurate payroll variance reports are mapping errors. Your actuals have to match your budget structure, or you're measuring mismatches instead of real variance.
Watch out for:
- Outdated or discontinued pay codes still firing in the payroll run
- Inconsistent department or cost-center names across systems
- New entities, acquisitions, or contractors not yet added to the budget model
- Incomplete capture of variable pay (bonuses, commissions, shift premiums)
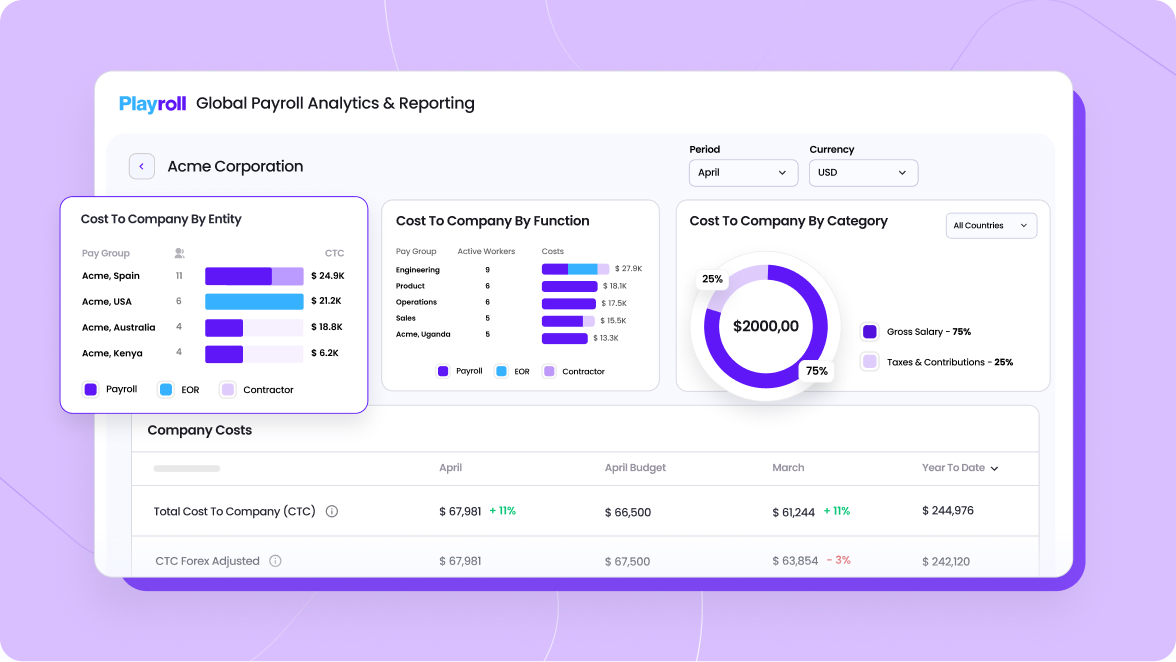
For global teams, this gets harder quickly. Each country has its own pay elements, tax structures, and classification rules, and a manual reconciliation across five or ten entities is where most variance projects fail. Analytics software like Playroll’s can help consolidate fragmented payroll data across entities into a single structure.This removes most of the mapping drift before the analysis even starts.
Hiring or Running Payroll In Multiple Countries?
Playroll's country guides break down statutory pay elements, tax structures, and compliance rules for 180+ countries – so you know exactly which line items should be hitting your variance report.
Explore the Guides
Step 3: Reconcile Salaried and Hourly Employee Treatments
Salaried and hourly employees produce different variance behavior, and mixing them in one calculation will distort your results.
Employee Type
How to Calculate Variance
Hourly
(Actual paid hours × actual pay rate) – (Budgeted hours × standard rate)
Example: A warehouse worker was budgeted for 160 hours at $20/hour ($3,200), but logged 175 hours at $22/hour due to overtime ($3,850). Variance = $650 unfavorable, driven by both rate ($2/hour premium) and efficiency (15 extra hours).
Salaried
Standard salary allocation – Actual salary entries (flag one-off deviations)
Example: A marketing manager's standard monthly allocation is $8,333 ($100K ÷ 12), but April's actual entry shows $10,833 due to a one-time $2,500 retention bonus. Variance = $2,500 unfavorable, flagged as a non-recurring deviation rather than an ongoing cost issue.
Salaried workers earn the same pay no matter how many hours they work, so their variance usually reflects allocation rules, rounding, or mid-period changes (promotions, leave, severance) rather than true pay anomalies. Hourly variance, by contrast, is sensitive to overtime, absenteeism, and staffing changes week to week.
Step 4: Calculate Absolute and Percentage Payroll Variances
Once your data is clean and your baseline is locked, run the numbers two ways: absolute and percentage.
Absolute variance tells you the magnitude. Percentage variance tells you whether that magnitude matters relative to the size of the cost center. A $50,000 variance on a $100,000 team is a five-alarm fire. The same $50,000 on a $10 million global payroll falls within normal operating noise.
Most finance teams set materiality thresholds based on percentage (typically 3–5%) and flag anything above that for deeper investigation. Below the threshold, you record and move on.
Step 5: Decompose Payroll Variance into Rate, Efficiency, and Timing Factors
A variance total is only useful if you can explain it. Decomposition breaks the total into three drivers so you know where to focus.
Run each driver separately for every cost center that breaches your materiality threshold. You'll quickly see what kind of problem your variance is.
- A Rate Problem: You're paying more or less than planned
- An Efficiency Problem: People are working more or less hours than planned
- Or A Timing Problem: The money's recorded in the wrong period
Step 6: Validate Data, Investigate Outliers, and Annotate Findings
Before anyone takes action on a variance, validate the data one more time. Re-run the source extract, reconcile to the general ledger, and check outliers against known business events. A spike in payroll variance for one department might be a genuine overspend, or it might be a bonus cycle that was posted a week earlier than last year.
Annotate every material variance directly in the report. For each line item, note:
- Whether the variance is one-off (timing, bonus, severance) or recurring (mis-forecasted rate, structural overtime)
- The underlying business event or data issue
- Whether any correction is required
Good annotation is the difference between a variance report that gets actioned and one that gets filed. It also creates the audit trail you need when finance, internal audit, or external auditors start asking questions.
Step 7: Report Variance Results, Assign Ownership, and Implement Actions
The final step turns analysis into accountability. Without ownership, reports become read-only artifacts. With it, variance investigation becomes part of the monthly close rhythm and drives real process improvement. It can be used to update your forecasts, correct mappings, and revise poor approval workflows.
A usable payroll variance report includes:
- Summary table of variances by entity, department, or cost center
- Visual charts (typically a waterfall or bar chart showing favorable vs. unfavorable drivers)
- Narrative commentary on material variances
- Assigned owner for each flagged item
- Recommended actions and target close date
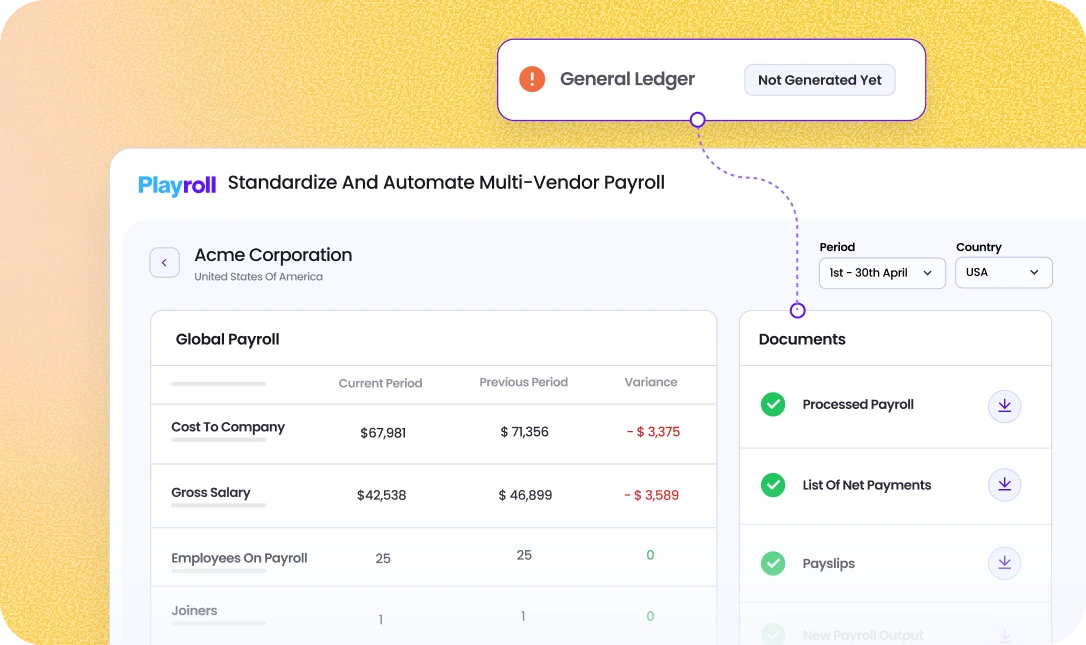
For multi-entity global operations, this is where centralized dashboards earn their keep. Instead of emailing spreadsheets between country controllers, an automated payroll variance report consolidates every entity into one view with owners, statuses, and action items tracked in real time.
Playroll is Leading Global Payroll Variance Accuracy with AI-Powered Insights
Playroll centralises payroll data across every entity you operate in, automates variance calculations, and uses AI to flag anomalies the moment a run closes – so a mis-mapped pay code or regional rate drift surfaces immediately.
Instead of stitching exports from six local providers together, your team works from one reconciled dataset with owners, annotations, and action items already attached to each flagged variance. Payroll variance won't disappear, but it shouldn't be a mystery either.
If you're ready to see what centralized global payroll variance reporting looks like in one platform, book a demo with Playroll and we’ll provide a tailored walkthrough.
ABOUT THE AUTHOR
Jaime Watkins
Jaime is a content specialist at Playroll, specializing in global HR trends and compliance. With a strong background in languages and writing, she turns complex employment issues into clear insights to help employers stay ahead of the curve in an ever-changing global workforce.
How to Calculate Payroll Variance FAQ
What is payroll variance and why does it matter?

.png)
Payroll variance is the difference between your expected (budgeted) payroll costs and your actual payroll expenses, and it matters because monitoring it helps you stay on budget, catch payroll errors early, and flag compliance risks before they affect your financial results or show up in an audit.
How do I determine the correct baseline for payroll variance?
To determine the correct baseline for payroll variance, use your payroll budget, standard pay rates, or planned job allocations for each period – and whichever you choose, apply it consistently across every variance cycle, because moving baselines hide real performance trends.
What common errors affect payroll variance accuracy?
The common errors that affect payroll variance accuracy are outdated or moving baselines, mis-mapped cost centers or pay codes, and skipping root-cause decomposition. All three make your variance numbers look precise while obscuring what's actually driving them.
How can automation improve payroll variance calculations?
Automation improves payroll variance calculations by removing manual entry errors, standardizing data across sources, and cutting reporting time from days to minutes. Modern payroll platforms also deliver real-time variance alerts and built-in reports, so issues surface as they happen instead of at month-end close.
What steps should I take when significant payroll variances occur?
When significant payroll variances occur, the first step is to validate your data (mapping and entry errors cause more "variances" than actual overspend), then decompose the variance into rate, efficiency, and timing drivers. From there, document your findings, assign a named owner, and track the corrective action through to close.

Back to Top
.svg)


.svg)